By default, Ferret displays X- and Y-axes with tics and numeric labels at reasonable intervals and a label for each axis. Time axes are also automatically formatted and used as needed. These axis features can be modified or suppressed using the following Ferret direct controls and PPLUS commands.
The following qualifiers are used with graphical output commands PLOT, VECTOR, SHADE, and CONTOUR to specify axis limits, tic spacing, and possible axis reversal:
Ferret qualifers
/HLIMITS, /VLIMITS, /NOAXIS
The /HLIMITS and /VLIMITS qualifiers use the syntax /HLIMITS=lo:hi:delta. Tic marks are placed every "delta" units, starting at "lo" and ending at "hi". Every other tic mark is labeled. "delta" may be negative, in which case the axis is reversed.
The /NOAXIS qualifier removes both X and Y axes from the plot. This is particularly useful for plots using curvilinear coordinates (map projections) where the final axis values represent transformed axis values rather than world coordinates.
The following arguments to SET MODE and CANCEL MODE determine axis style (e.g., SET MODE CALENDAR:days) :
Ferret arguments
SET MODE CALENDAR
SET MODE LATIT_LABEL
SET MODE LONG_LABEL
See the next section for more about customizing axes, tic marks, labels and coordinate labels.
See SET MODE for more information.
PPLUS commands can be used to customize axis settings. Note that Ferret makes settings for all of these automatically; you will only need to make PPLUS calls to change the axis properties. See the examples below, and the section on PPLUS graphical commands for more on the syntax to make PPLUS calls.
|
Command |
Function |
|
XAXIS* |
controls numeric labeling and tics on the X axis (redundant with /HLIMITS) PPL XAXIS |
|
YAXIS* |
controls numeric labeling and tics on the Y axis (redundant with /VLIMITS) PPL YAXIS |
|
AXATIC |
sets number of large tics automatically for X and Y PPL AXATIC |
|
AXLABP |
locates or omits axis labels at top/bottom or left/right of plot PPL AXLABP |
|
AXLEN** |
sets axis lengths PPL AXLEN |
|
AXLINT |
sets numeric label interval for axes every nth large tic PPL AXLINT |
|
AXLSZE |
sets axis label heights PPL AXLSZE |
|
AXNMTC |
sets number of small tics between large tics on axes PPL AXNMTC |
|
AXNSIG |
sets number of significant digits in numeric axis labels PPL AXNSIG |
|
AXSET |
allows omission of plotting of any axis (redundant with /AXES=) PPL AXSET |
|
AXTYPE |
sets axis type (linear, log, inv. log) for x- and y-axis(See also /HLOG,/VLOG qualifiers on plot commands) PPL AXTYPE |
|
TICS |
sets axis tic size and placement inside or outside axes PPL TICS |
|
XFOR* |
sets format of x-axis numeric labels PPL XFOR |
|
YFOR* |
sets format of y-axis numeric labels PPL YFOR |
|
XLAB* |
sets label of x-axis PPL XLAB |
|
YLAB |
sets label of y-axis* PPL YLAB |
|
TXLABP |
establishes time axis label position (or absence) PPL TXLABP |
|
TXTYPE* |
sets the style of the time axis PPL TXTYPE |
|
TXLINT* |
specifies which time axis tics will be labeled PPL TXLINT |
|
TXLSZE |
sets height of time axis labels PPL TXLSZE |
|
TXNMTC |
sets number of small tics between large tics on time axis PPL TXNMTC |
* issued by Ferret with every relevant plot
** issued by Ferret upon SET WINDOW/ASPECT or SET VIEWPORT
Examples
1) Plot with no axis labels (character or numeric) and no tics (Figure 6_2). (Equivalent to
yes? GO box_plot PLOT/I=1:10/NOLABEL 1/i)
yes? PLOT/i=1:30/NOLABEL/SET 1/i
yes? PPL AXLABP 0,0 !turn off numeric labels
yes? PPL TICS 0,0,0,0 !suppress small and large tics
yes? PPL PLOT !render plot
yes? PPL TICS .125,.25,.125,.25 !reset tics to default
yes? PPL AXLABP -1,-1 !reset numeric labels
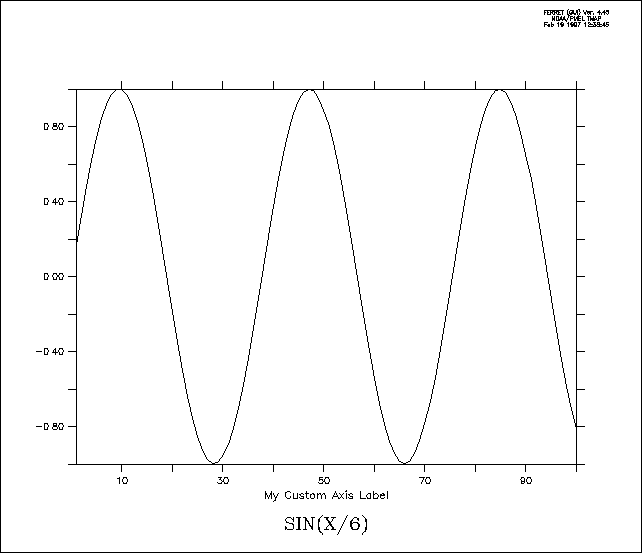
2) customize x-axis label (Figure6_3); XLAB always reset by Ferret)
yes? PLOT/SET/i=1:100 sin(x/6)
yes? PPL XLAB My Custom Axis Label
yes? PPL PLOT
3) specify tic frequency for y axis
yes? PLOT/i=1:30/YLIM=0:1:.2 1/i
4) Specify the size and location of tic marks on the axes. The PPLUS tics command is
PPL TICX,smx,lgx,smy,lgy,ix,iy
ix and iy are 1 for tics inside the plot box, 0 to straddle the axis line, and -1 for tics outside the axis with -1 as default. These commands put large tics inside the axes.
yes? SHADE/SET/i=1:100/j=1:15 sin(x/6)*10./j
yes? PPL TICS .0,.35,.0,.35,1,1
yes? PPL SHADE
See also the /GRATICULE qualifier available on all plotting commands (PLOT/GRATICULE, CONTOUR/GRATICULE, etc.)
The PPLUS commands XFOR and YFOR control the format of the labels for coordinates along the axes. These apply FORTRAN format syntax to override the automatic formatting.
Starting with Ferret v6.0, the PPL XFOR and PPL YFOR commands may be used with special syntax when the axes represent longitude and latitude; to specify that the coordinates that are labeled along the axis should be shown as degrees minutes (and optionally seconds) instead of the default labels of degrees and decimal fractions of degree
Example:
yes? use coads_climatology
yes? SET VIEW upper
yes? SHADE airt ! Default axis formatting
yes? SET VIEW lower
yes? SHADE/SET airt
yes? PPL XFOR (F7.2) ! XFOR specifies a fortran format
yes? PPL YFOR (dm) ! YFOR (dm) specifes degrees and minutes
yes? PPL SHADE
6.3.3 Overlaying symbols on a time axis
To overlay symbols or mark-up on a plot which has a formatted time axis (dates and times) it is necessary to specify positions using the internal time encoding of that axis. Typically, the easiest way to achieve this is to define a variable, say TT, which is the time encoding. This example illustrates.
Example:
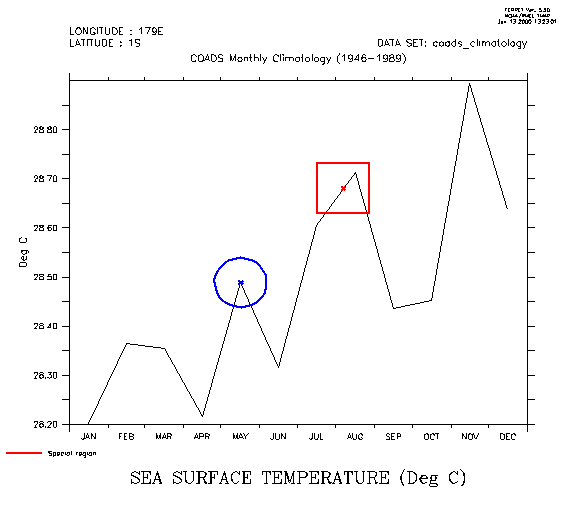
demonstrate PLOT/VS and POLYGON over time axes (Figure 6_4)
USE coads_climatology
LET xsqr = {-1,1,1,-1} ! coordinates of a unit square
LET ysqr = {-1,-1,1,1}

LET xcircle = COS(6.3*i[i=1:42]/40) ! coordinates of unit circle
LET ycircle = SIN(6.3*i[i=1:42]/40) ! Notice the units of the time axis
SHOW GRID/L=1:3 sst

PLOT/X=180/Y=0 sst ! draw a time series plot

LET tt = T[GT=sst] ! tt is the coordinates along the T axis

! place an "X" at the value exactly at 7-aug
! "@ITP" causes interpolation to exact location

LET t0 = tt[T="7-aug-0000"@itp]
LET val0 = sst[X=180,Y=0,T="7-aug-0000"@itp]
PLOT/VS/OVER/NOLAB/SYM=2/LINE=8 t0,val0

! put a box around the "X"
POLYGON/OVER/LINE=8/TITLE="Special region" t0+500*xsqr, 0.05*ysqr+val0

! place an "X" on the data point nearest to 15-may
! Note that @ITP is absent, so behavior is set by MODE INTERPOLATE

LET t1 = tt[t="15-may-0000"]
LET val1 = sst[x=180,y=0,t="15-may-0000"]
PLOT/VS/OVER/NOLAB/SYM=2/LINE=10 t1,val1

! put a circle around the "X"
PLOT/VS/OVER/LINE=10/nolab t1+500*xcircle,0.05*ycircle+val1
Example (continued):
mark-up over a Hovmoller diagram (Figure 6_5)
SHADE/X=180 sst ! latitude vs time plot
LET tlo = tt[T="1-jul-0000"@itp]
LET thi = tt[T="1-aug-0000"@itp]
POLYGON/OVER/LINE=7/PAL=gray/PAT=lite_up_left_to_right {`tlo`,`thi`,`thi`,`tlo`}, {20, 20, 40, 40}


