Below is an annotated version of the script ef_fft_demo.jnl
yes? go/help ef_fft_demo

! Description: Demonstration of external functions for Fast Fourier Transforms:
FFTA computes amplitude spectrum
FFTP computes phase
The functions operate on the full time axis from the input grid without requiring the explicit time specification; if a subset of time is desired, specify that within the function call, see the Ferret documentation about Grid Changing Functions.
The functions set the units for the frequency axis to "1./(time units)" with the time units taken from the Ferret variable.
Example:
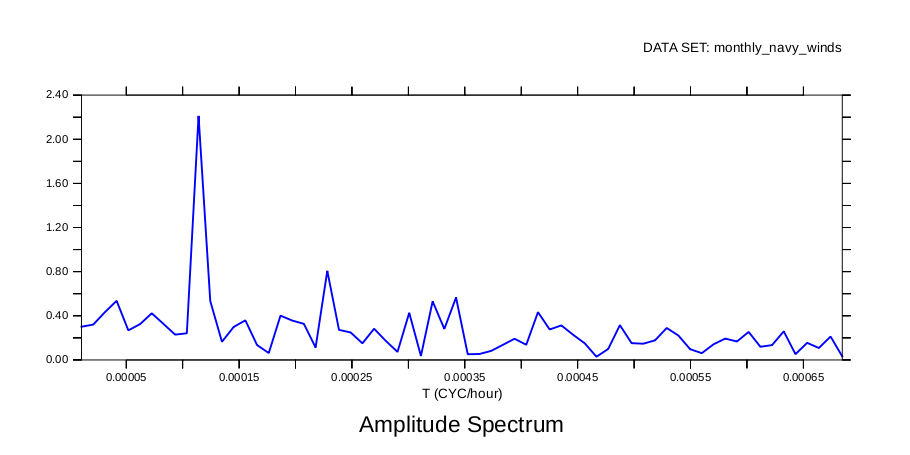
We will plot an FFT for the monthly_navy_winds and look for the annual cycle.
Open the datset, and compute an average over an XY region. Plot the FFT
yes? USE monthly_navy_winds
yes? LET FFT_uwndtim = uwnd[x=150e:130w@ave,y=20n:40n@ave]
yes? LET/TITLE="Amplitude Spectrum"  FFT_uwndfft = ffta(FFT_uwndtim)

yes? plot/thick/color=blue FFT_uwndfft
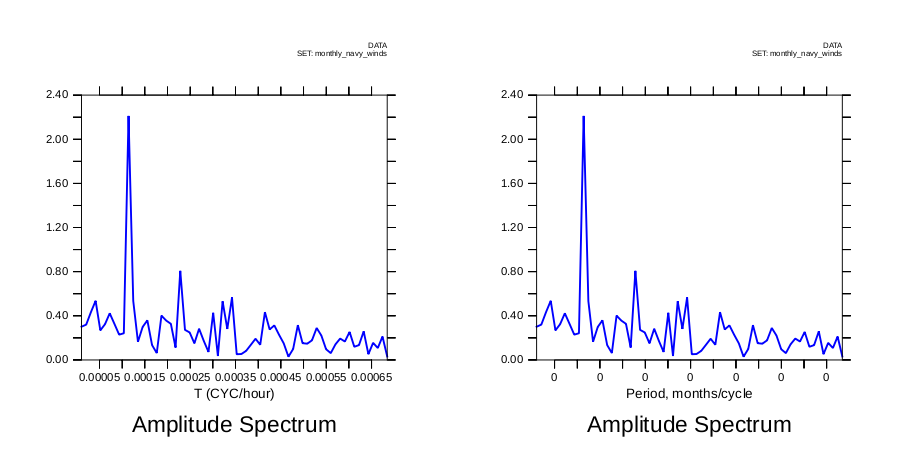
For easier interpretation, invert the frequency axis and plot the spectrum vs period; months/cycle
Get the frequency increment used in the FFT.
yes? LET FFT_nf = `FFT_uwndfft,return=lend`

yes? LET FFT_nyquist = 0.5
yes? LET FFT_freq1 = FFT_nyquist/ FFT_nf
Define a frequency axis.
yes? DEFINE AXIS/T=`FFT_freq1`:`FFT_nyquist`:`FFT_freq1` FAXIS
yes? LET a = T[gt=FAXIS]
Define the period from the frequency axis.
yes? LET per = 1./a
Plot period vs FFT Amplitudes showing the first 24 months where most of the energy is.
The PPL commands clean up the appearance of the plot.
yes? SET VIEW right
yes? PLOT/VS/LINE/HLIMITS=0:30:2/TITLE="Amplitude Spectrum"/SET_UP per[l=1:`FFT_nf`], FFT_uwndfft
yes? PPL XFOR (I2)
yes? PPL XLAB Period, months/cycle
yes? PPL YLAB
yes? PPL PLOT
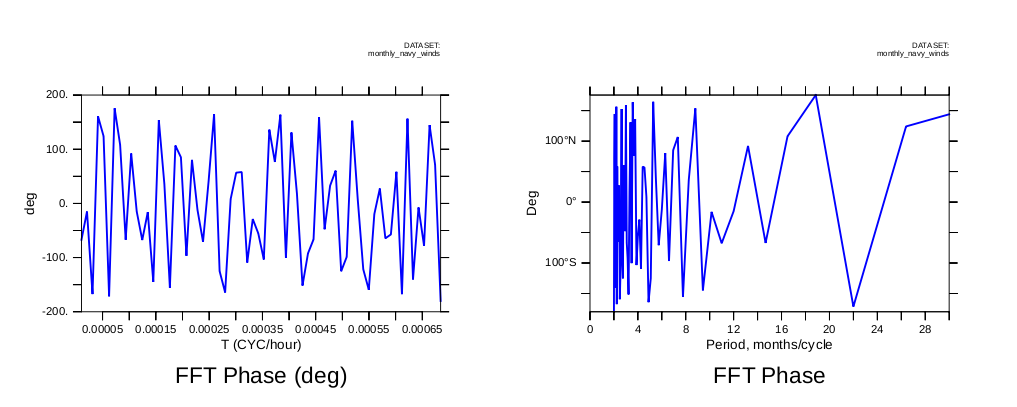
Compute and plot the phase using the function FFTP.
yes? LET/TITLE="FFT Phase"/UNITS="deg" FFT_uwndfftp = fftp(FFT_uwndtim)

yes? SET VIEW left
yes? PLOT FFT_uwndfftp

yes? SET VIEW right
yes? PLOT/VS/LINE/HLIMITS=0:30:2/TITLE="FFT Phase"/SET_UP  per[l=1:`FFT_nf`],FFT_uwndfftp

yes? PPL XFOR (I2)
yes? PPL XLAB Period, months/cycle
yes? PPL YLAB Deg
yes? PPL PLOT