
Below is an annotated version of the scriptpalette_demo.jnl
There are 3 types of color palettes: PERCENT, BY_LEVELS, and BY_VALUES. All palettes consist of a list of RGB color values and associated with each RGB value another value that determines how to map the color onto the "Z axis" of the plot.
Note: from the Unix prompt you can use
> Fpalette '*'
to see the available palettes, or
> Fpalette cyan
* * * * * * * * in /home/users/tmap/ferret/linux/ppl
cyan_dark.spk:
cyan_light.spk:
cyan.spk:
shows all palettes whose names include "cyan".
A PERCENT palette is an ordered sequence of RGB valuesrepresenting a piecewise continuous path through color space.For a given plot with N contour levels the set of discrete colorsused are determined by interpolating to N-1 equally spaced pointsalong this path.
set up
yes? SET WINDOW/ASPECT=1.2:axis
yes? DEFINE VIEWPORT/x=0.02:0.98/y=0:.33 low
yes? DEFINE VIEWPORT/x=0.02:0.98/y=.33:.67 mid
yes? DEFINE VIEWPORT/x=0.02:0.98/y=.67:1 up
yes? cancel mode logo
yes? use levitus_climatology
! Here are examples using a PERCENT palette:
yes? ! set the palette to use. rainbow is the default.
yes? PALETTE rainbow
yes? ppl list shaset
RGB_MAPPING Percent

SET POINT       RED       GREEN        BLUE
0.0      80.0         0.0       100.0       100.0
10.0      30.0        20.0       100.0       100.0
33.0       0.0        60.0        30.0       100.0
66.0     100.0       100.0         0.0       100.0
90.0     100.0         0.0         0.0       100.0
100.0      60.0         0.0         0.0       100.0
yes? set view upper; go magnify 1.2
yes? FILL/levels=10 temp[z=0]; go land thick

yes? set view lower; go magnify 1.2
yes? FILL/lev=20 temp[z=0]; go land thick
BY_LEVELS palettes specify a list of invariant RGB color. The colors given in the list are exactly the colors that will be used on the plot -- no interpolation of colors is used. This is useful when representing discrete values such as "vegetation type". If the number of colors required for the plot exceeds the number given in the palette the colors are repeated starting from the first color as necessary. Note that this is the same logic used for pattern files.
From the Unix prompt try, for example, Fpalette -more rainbow_by_levels to see an example of a BY_LEVELS palette file.
yes? PALETTE rainbow_by_levels
yes? ppl list shaset

RGB_MAPPING By_level

LEVEL RED GREEN BLUE
1 80.0 0.0 100.0 100.0
2 30.0 20.0 100.0 100.0
3 0.0 60.0 30.0 100.0
4 100.0 100.0 0.0 100.0
5 100.0 0.0 0.0 100.0
6 60.0 0.0 0.0 100.0

yes? set view upper; go magnify 1.2
yes? FILL/levels=(15,30,2.5) temp[z=0]; go land thick

yes? set view lower; go magnify 1.2
yes? FILL/lev=(15,30,.5) temp[z=0]; go land thick

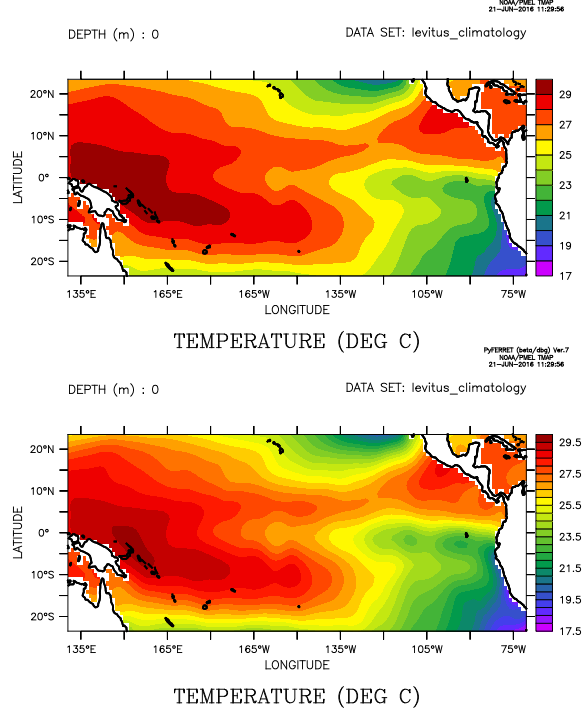
A BY_VALUE palette specifies a path through color space, much as does a PERCENT palette. However, the logic used to interpolate colors along the path is based on the data values of the the contour levels. With such a palette the color representing, say, 25 degree temperature will be the same whether the temperature range on the plot is large or small and whether 25 degrees lies at the lower end of the range or the upper.
From the Unix prompt try, for example,
> Fpalette -more ocean_temp
to see an example of a BY_VALUE palette file.
In this example, using a BY_VALUE palette, we see sequence of ocean temperature plots at increasing depth. Note how the colors adjust themselves to the temperature values. (Also note the details in labeling this set of plots: Label the dataset name only on the bottom plot. More could be done to un-clutter this plot; removing all labels from each frame except depth and labeling the dataset name only once on the page.)
yes? PALETTE ocean_temp
yes? ppl list shaset

RGB_MAPPING By_value

SET POINT RED GREEN BLUE
-2.0 80.0 0.0 100.0 100.0
0.0 30.0 20.0 100.0 100.0
10.0 0.0 60.0 30.0 100.0
20.0 100.0 100.0 0.0 100.0
30.0 100.0 0.0 0.0 100.0
35.0 60.0 0.0 0.0 100.0

yes? set view up; go magnify 1.2
yes? FILL/Z=0/title=" " temp; go land thick

yes? set view mid; go magnify 1.2
yes? FILL/Z=50/title=" " temp; go land thick

yes? set view low; go magnify 1.2
yes? FILL/Z=200 temp; go land thick
