6.2.1 Ferret graphical output controls
|
Ferret command |
Function |
|
CONTOUR |
produces a contour plot of a single field |
|
FILL |
alias for CONTOUR/FILL; produces color-filled contour plot |
|
PLOT |
produces a line or symbol plot of one or more arrays, or a scatter plot |
|
SHADE |
produces a shaded representation (rectangular cells) |
|
VECTOR |
produces a vector arrow plot |
|
WIRE |
produces a 3D wire frame plot |
|
SET WINDOW |
manipulates graphics windows |
|
SET VIEWPORT |
places graphics output into a sub-window (pane) |
6.2.2 PPLUS graphical output commands
The plot commands, in the table below, can be customized using /SET_UP to delay display. The PLOT/SET_UP is followed by PPLUS commands which customize the settings for axes, labels, plot layout, and so on. Then the plot will ultimately be rendered using a PPLUS graphical output command (not the Ferret counterpart). A customized contour or filled-contour plot is rendered with PPL CONTOUR, a wire frame plot with PPL VIEW and so on. Please see the overview of this chapter and also the discussion in the Commands Reference section about PPLUS.
In the following sections, there is a "PPLUS commands" subsection detailing which PPLUS commands are used for each type of customization. See the examples in those sections, and cross-references to the PPLUS command syntax in the PPLUS manual (Appendix B).
|
Command |
Function |
|
CONTOUR |
makes a contour plot |
|
PLOT |
plots x-y pairs for all lines of data |
|
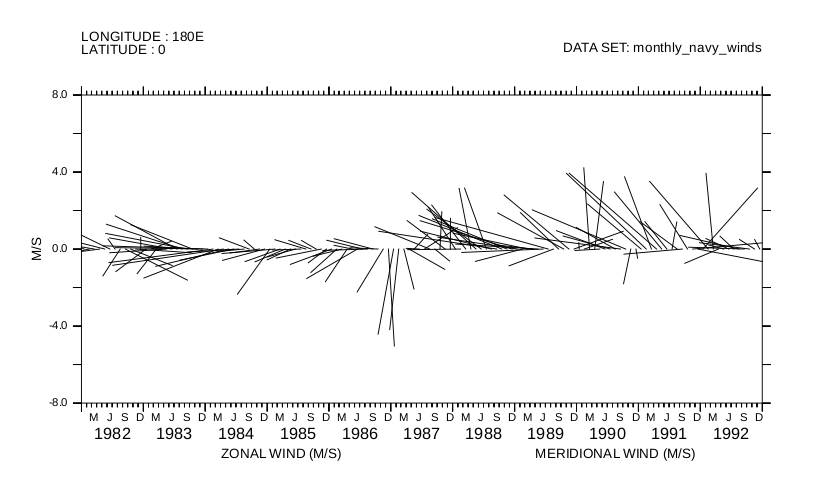
PLOTUV |
makes a stick plot of vector data |
|
SHADE |
makes a shaded representation |
|
VIEW |
makes a wire frame plot |
|
VECTOR |
makes a plot of a vector field |
The graphical output command PLOTUV can be used to make stick plots easily, as the following time series example shows.
yes? USE monthly_navy_winds
yes? PLOT/SET/X=180/Y=0 uwnd, vwnd
yes? PPL PLOTUV