Below is an annotated version of the script mp_demo.jnl
yes? go /help mp_demo

! Description: demo of map projection scripts
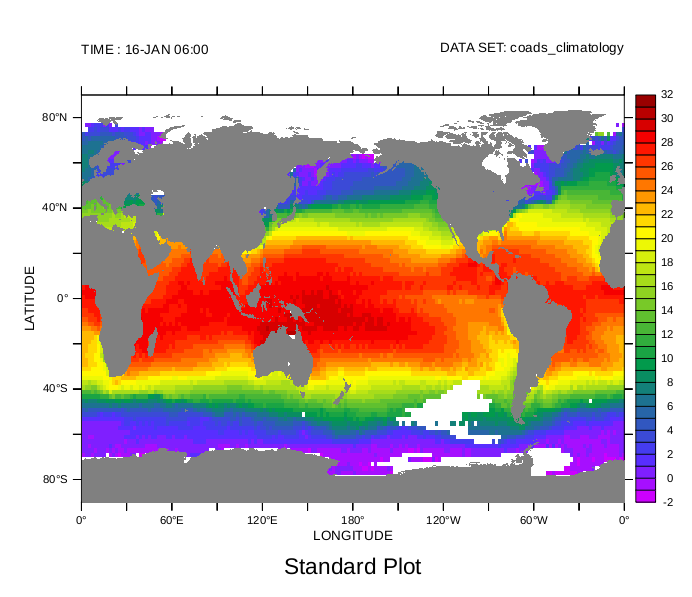
Here is your basic Ferret plot:
yes? USE coads_climatology
yes? SHADE/X=0:360/Y=-90:90/L=1/TITLE="Standard Plot" sst
yes? GO fland
yes? GO land
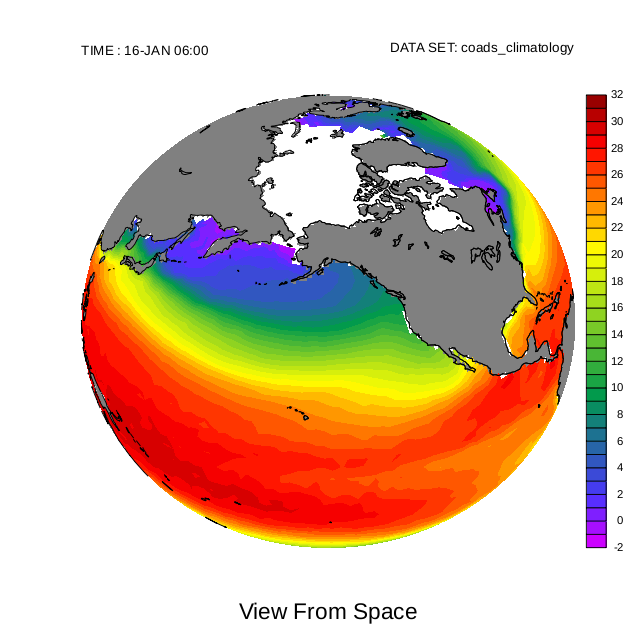
Here is a sampling of what you can do with map projections. Firstcase: a view from space. A variety of utility scripts are available, mp*.jnl. For more detail about these, use for example:
yes? go/help mp_aspect.jnl
The use of masked variables keeps the other side of the earth from "showingthrough" in projections where only part of the globe is towards theuser, such as the orthographic projections.
yes? USE coads_climatology
yes? SET REGION/X=0:360/Y=-90:90/L=1
yes? GO mp_orthographic 210 45
yes? SET GRID sst
yes? GO mp_aspect

yes? LET masked_sst = sst * mp_mask
yes? FILL/NOAX/NOLAB masked_sst, x_page, y_page
yes? LABEL/NOUSER `($PPL$XLEN)*0.5`,-0.4,0,0,0.2 View From Space
yes? GO mp_fland
yes? GO mp_land
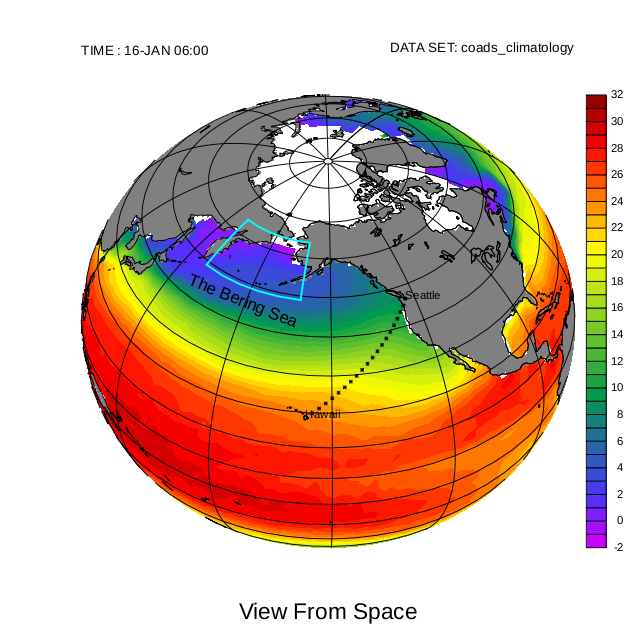
Let's add some labels in world coordinates, and two graticules: Onefor the whole world and one for the Bering Sea.
yes? GO mp_label 237.7 47.6 -1 0 .1 @p5@IISeattle
yes? GO mp_label 204.4 19.5 -1 0 .1 @p5@IIHawaii
yes? GO mp_graticule
yes? GO mp_graticule 160 200 40 50 65 15 11
yes? GO mp_label 180 45 0 -22 .15 "@p5@DRThe Bering Sea

Here's how you can plot your own data on top of the map projection. This one is a straight line between Hawaii and Seattle
yes? let a = 204.4 + (237.7-204.4)/20 * i
yes? let b = 19.5 + (47.6-19.5)/20 * i
yes? go mp_line plot/nolab/vs/over/i=1:20 a b
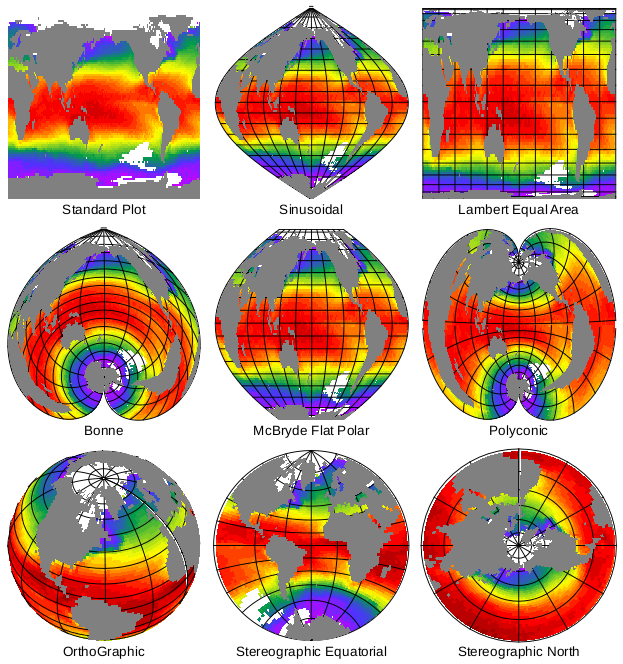
Now, a menagerie of projections from among those provided with Ferret.
yes? set win/aspect=1:ax
yes? define viewport/xlimits=0.000,0.333/ylim=0.666,0.999 tl
yes? define viewport/xlimits=0.000,0.333/ylim=0.333,0.666 ml
yes? define viewport/xlimits=0.000,0.333/ylim=0.000,0.333 bl
yes? define viewport/xlimits=0.333,0.666/ylim=0.666,0.999 tm
yes? define viewport/xlimits=0.333,0.666/ylim=0.333,0.666 mm
yes? define viewport/xlimits=0.333,0.666/ylim=0.000,0.333 bm
yes? define viewport/xlimits=0.666,0.999/ylim=0.666,0.999 tr
yes? define viewport/xlimits=0.666,0.999/ylim=0.333,0.666 mr
yes? define viewport/xlimits=0.666,0.999/ylim=0.000,0.333 br

yes? set region/x=0:360/y=-90:90/l=1

yes? set view tl
yes? go margins .2, .6, .2, .2
yes? shade/nolab/nokey/noaxes sst
yes? go fland 120 gray
yes? label/nouser `($PPL$XLEN)*0.5`,-0.4,0,0,.20 Standard Plot

yes? set view tm
yes? go mp_sinusoidal
yes? go margins .2, .6, .2, .2
yes? shade/nolab/nokey/noaxes sst, x_page, y_page
yes? go mp_graticule
Replacing definition of axis LON_FIELD_I_AXIS
Replacing definition of axis LON_FIELD_J_AXIS
Replacing definition of axis LAT_FIELD_I_AXIS
Replacing definition of axis LAT_FIELD_J_AXIS
yes? go mp_fland 120 gray
yes? label/nouser `($PPL$XLEN)*0.5`,-0.4,0,0,.20 Sinusoidal

yes? set view tr
yes? go mp_lambert_cyl
yes? go margins .2, .6, .2, .2
yes? shade/nolab/nokey/noaxes sst, x_page, y_page
yes? go mp_graticule
yes? go mp_fland 120 gray
yes? label/nouser `($PPL$XLEN)*0.5`,-0.4,0,0,.20 Lambert Equal Area

yes? set view ml
yes? go mp_bonne
yes? go margins .2, .6, .2, .2
yes? shade/nolab/nokey/noaxes sst, x_page, y_page
yes? go mp_graticule
yes? go mp_fland 120 gray
yes? label/nouser `($PPL$XLEN)*0.5`,-0.4,0,0,.20 Bonne

yes? set view mm
yes? go mp_mcbryde_fpp
yes? go margins .2, .6, .2, .2
yes? shade/nolab/nokey/noaxes sst, x_page, y_page
yes? go mp_graticule
yes? go mp_fland 120 gray
yes? label/nouser `($PPL$XLEN)*0.5`,-0.4,0,0,.20 McBryde Flat Polar

yes? set view mr
yes? go mp_polyconic
yes? go margins .2, .6, .2, .2
yes? shade/nolab/nokey/noaxes sst, x_page, y_page
yes? go mp_graticule
yes? go mp_fland 120 gray
yes? label/nouser `($PPL$XLEN)*0.5`,-0.4,0,0,.20 Polyconic

yes? set view bl
yes? go mp_orthographic 300 45
yes? go margins .2, .6, .2, .2
yes? let masked_sst = sst * mp_mask
yes? shade/nolab/nokey/noaxes masked_sst, x_page, y_page
yes? go mp_graticule
yes? go mp_fland 120 gray
yes? label/nouser `($PPL$XLEN)*0.5`,-0.4,0,0,.20 OrthoGraphic

yes? set view bm
yes? set region/x=240:420
yes? go mp_stereographic_eq
yes? go margins .2, .6, .2, .2
yes? shade/nolab/nokey/noaxes sst, x_page, y_page
yes? go mp_graticule 240 420 30 -90 90 15
Replacing definition of axis LON_FIELD_I_AXIS
Replacing definition of axis LON_FIELD_J_AXIS
Replacing definition of axis LAT_FIELD_I_AXIS
Replacing definition of axis LAT_FIELD_J_AXIS
yes? go mp_fland 120 gray
yes? label/nouser `($PPL$XLEN)*0.5`,-0.4,0,0,.20 Stereographic Equatorial

yes? set view br
yes? set region/x=0:360/y=00:90
yes? go mp_stereographic_north
yes? go margins .2, .6, .2, .2
yes? shade/nolab/nokey/noaxes sst, x_page, y_page
yes? go mp_graticule 0 360 30 0 90 15
Replacing definition of axis LON_FIELD_I_AXIS
Replacing definition of axis LON_FIELD_J_AXIS
Replacing definition of axis LAT_FIELD_I_AXIS
Replacing definition of axis LAT_FIELD_J_AXIS
yes? go mp_fland 120 gray
yes? label/nouser `($PPL$XLEN)*0.5`,-0.4,0,0,.20 Stereographic North
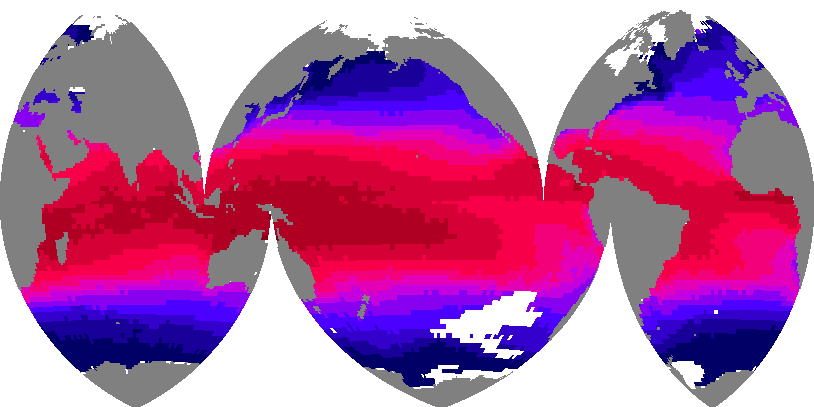
Finally, we'll create a fancy strip map centered on the Pacific
yes? ! to see the script's commands:
yes? ! yes? go/help mp_ocean_stripmap.jnl

yes? set win/size=.4/aspect=.5 3
yes? go mp_hammer
yes? set grid sst
yes? go mp_ocean_stripmap sst lev=(-2,20,4)(20,34,2) no_green 1 0