  • Home
  • Documentation
  • FAQ
  • Downloads
  • Support
  • Current Release Notes
  • Ferret Users Guide
    • Users Guide Index
    • Commands Reference
    • 1. Introduction
    • 2. Data Set Basics
    • 3. Variables & Expressions
    • 4. Grids & Regions
    • 5. Animations & Gif Images
    • 6. Customizing Plots
    • 7. Handling String Data Symbols
    • 8. Working with Special Data Sets
    • 9. Computing Environment
    • 10. Converting to NetCDF
    • 11. Writing External Functions
    • Glossary
    • Appendix A: Functions
    • Appendix B: PPLUS Guide
    • Appendix C: Ferret-Specific PPLUS Enhancements
  • Previous Release Notes
  • Tutorials and Demos
    • Ferret Tour
    • DSG files: Discrete Sampling Geometries Demo
    • Ferret sorting demo
    • Fast Fourier Transforms demo
    • Empirical Orthogonal Functions demo
    • Ferret objective analysis demo
    • Ferret Palette Demo
    • Map projections
    • Ferret polygon vector demo
    • Ferret Graticules demo
    • Ferret Polytube Demo
    • Ferret Polymark Demo
    • Ferret Constant-Array demo
    • Ferret land_detail demo
    • COADS Tour
    • Levitus Tour
    • Use OPeNDAP
    • Ferret binary read demo
  • PyFerret
    • PyFerret Downloads and Install
    • What is PyFerret?
    • Why use PyFerret?
    • PyFerret for the Ferret user
    • PyFerret command syntax: quick-start notes
    • PyFerret for the Python user
    • Graphics in PyFerret ?
    • New Ferret functionality
    • PyFerret Python functions and constants
    • PyFerret Python objects and methods
    • Ferret external functions in Python
    • Ferret Fortran external functions
    • PyFerret metadata-and-data dictionaries
  • OPeNDAP
    • OPeNDAP usage in Ferret
    • Use OPeNDAP Demo
    • Test OPeNDAP

Ferret land_detail demo

How to use the land_detail script

Below is an annotated version of the script land_detail_demo.jnl

Description: demonstrate detailed land data in the dataset geo_borders_intermed.nc


land_detail.jnl and mp_land_detail.jnl can plot or overlay continent,national, and state boundaries, and also major and secondary rivers and international marine boundaries. Their arguments are as follows:

! arg1 continent_pen ! arg2 "basemap" "overlay", or omitted for overlay! arg3 country_pen Pen for optional national boundaries ! arg4 state_pen Pen for optional state boundaries (Western hemisphere)! arg5 rivers_pen Pen for largest rivers! arg6 more_rivers Pen for additional rivers ! arg7 marine boundaries Pen for marine boundaries in South Pacific, Bering Strait

The pen specifications can be color names, which are drawn within lines, or color numbers which can include a thickness specification.See

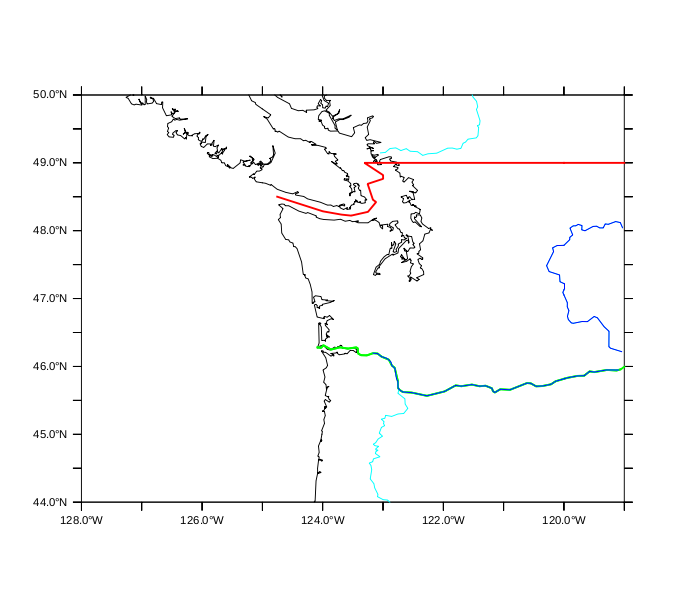
! U.S. State boundaries are available in the North and South America. Here we use pen-color codes 8 and 9 for national and state boundaries in red and green, so that the rivers show up on top of the national or state boundary lines.

yes? go fland 20 white basemap solid x=232:241 y=44:50
yes? go land_detail black overlay 8 9 blue lightbluen

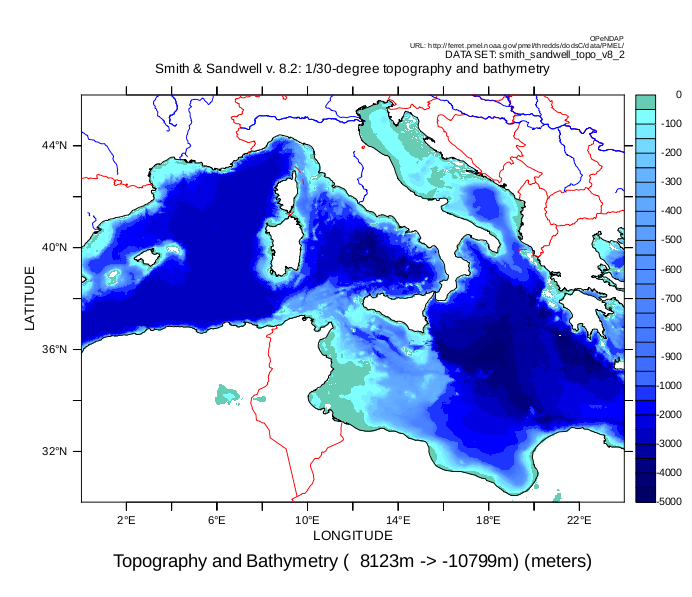
Now show a color plot with national boundaries and rivers. Access the detailed topography/bathymetry data from Smith and Sandwell via OPeNDAP.

yes? use "https://data.pmel.noaa.gov/pmel/thredds/dodsC/data/PMEL/smith_sandwell_topo_v8_2.nc"
yes? fill/lev=(-5000,-1000,500)(-1000,0,50)/pal=topo/x=0:24/y=30:46 rose
yes? go land_detail black overlay red " " blue blue

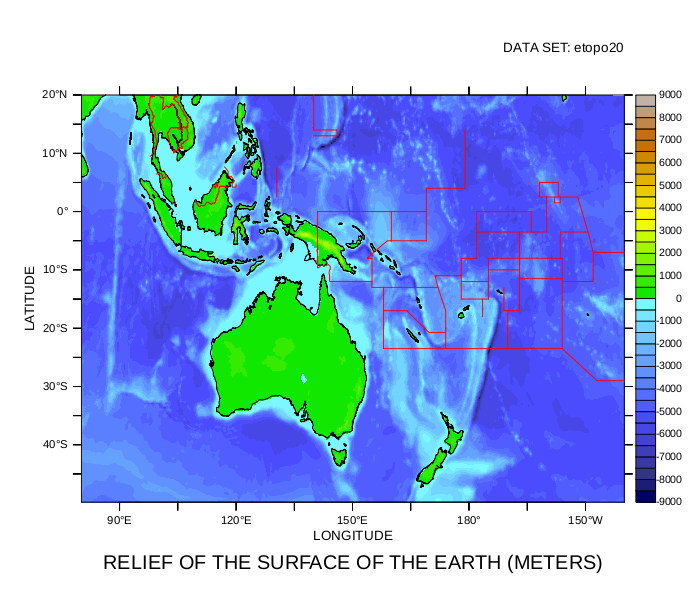
Now show a plot with international marine boundaries marked

yes? use etopo20yes? fill/x=80:220/y=-50:20/pal=land_sea/lev=(-9000,9000,500) rose