See also the command-syntax summary of commands and command options for PyFerret only
Using the pyferret script provided by PyFerret, a user directly access the traditional command-line interface to Ferret. These sessions will appear the same traditional Ferret sessions. Just like traditional ferret, some environment variables for Ferret need to defined beforehand using the ferret_paths script. This only needs to be done once in your terminal, and may be automatically done in your terminal start-up scripts. For C-shell users, the command would look something like:
For Bourne-shell users, the command would instead look like:
$ . /path/to/PyFerret/ferret_paths.sh
Note: During installation of Ferret and PyFerret, the script ferret_paths might be created, but is just a link to either the ferret_paths.csh or ferret_paths.sh script.
Then the pyferret command (script) can be used just the same as the ferret command (executable).
NOAA/PMEL TMAP
FERRET v6.96 (PyFerret 1.2)
Linux 2.6.32-573.7.1.el6.x86_64 - 11/24/15
30-Nov-15 14:49

yes? use coads_climatology
 currently SET data sets:
1> ..../data/coads_climatology.cdf (default)
name title I J K L M N
SST SEA SURFACE TEMPERATURE 1:180 1:90 ... 1:12 ... ...
AIRT AIR TEMPERATURE        1:180 1:90 ... 1:12 ... ...
SPEH SPECIFIC HUMIDITY      1:180 1:90 ... 1:12 ... ...
WSPD WIND SPEED             1:180 1:90 ... 1:12 ... ...
UWND ZONAL WIND             1:180 1:90 ... 1:12 ... ...
VWND MERIDIONAL WIND        1:180 1:90 ... 1:12 ... ...
SLP SEA LEVEL PRESSURE      1:180 1:90 ... 1:12 ... ...

yes? list sst[X=175E:175W,Y=5S:5N,T=17-MAR]
VARIABLE : SEA SURFACE TEMPERATURE (Deg C)
FILENAME : coads_climatology.cdf
FILEPATH : ..../data/
SUBSET : 6 by 6 points (LONGITUDE-LATITUDE)
TIME : 17-MAR 02:58
175E 177E 179E 179W 177W 175W
78 79 80 81 82 83
5N / 48: 28.35 28.26 28.18 27.89 27.86 27.92
3N / 47: 28.49 28.38 28.01 27.92 27.98 27.71
1N / 46: 28.23 28.13 27.76 28.05 27.55 27.72
1S / 45: 27.85 28.52 28.35 27.83 27.99 28.22
3S / 44: 28.90 28.93 28.60 28.09 28.36 27.76
5S / 43: 29.29 29.17 28.93 28.81 28.79 28.67
yes? quit
The pyferret script supports all of the command-line options of the traditional Ferret executable, including -batch imagefilename and -script scriptfilename .... Some behavior from the graphics-related command-line options may have changed slightly (for example, PNG images are created instead of GIF images and PostScript files are created instead of GKS metafiles) due to the graphics engine changes. Changes in the Ferret graphics are discussed further in the Graphics in PyFerret section.
So the following session works as expected. The contents of the HIplots.jnl script are echoed in the output shown.
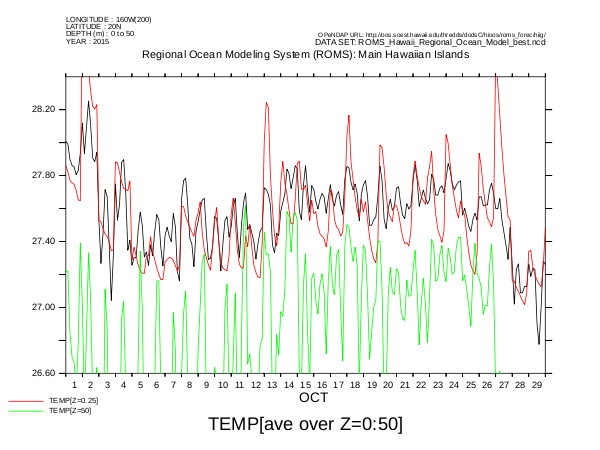
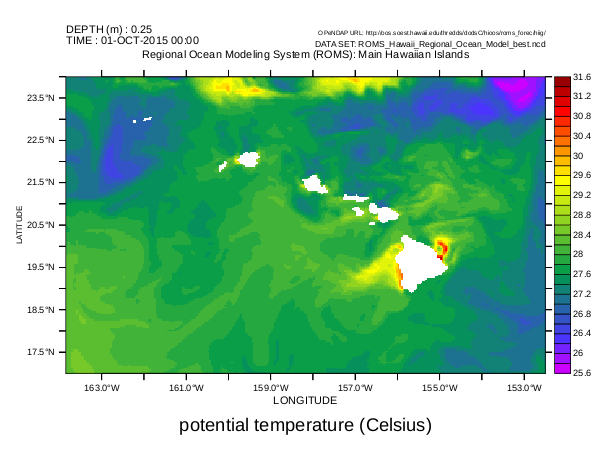
! -nodisplay is the same as -unmapped; no X-Windows display is required.

! select a dataset

SET DATA "http://oos.soest.hawaii.edu/thredds/dodsC/hioos/roms_forec/hiig/ROMS_Hawaii_Regional_Ocean_Model_best.ncd"

! show the contents of this dataset currently SET data sets:
show data
1> http://oos.soest.hawaii.edu/thredds/dodsC/hioos/roms_forec/hiig/ROMS_Hawaii_Regional_Ocean_Model_best.ncd (default)
name title I J K L M N
TIME_RUN run times for coordinate = time ... ... ...  1:1881 ... ...
TIME_OFFSET
offset hour from start of run f          ... ... ...  1:1881 ... ...
MASK field mask 1:295 1:195              ... ... ...  ...
ZETA free-surface                    1:295 1:195 ...  1:1881 ... ...
U u-velocity component               1:295 1:195 1:36 1:1881 ... ...
V v-velocity component               1:295 1:195 1:36 1:1881 ... ...
TEMP potential temperature           1:295 1:195 1:36 1:1881 ... ...
SALT salinity                        1:295 1:195 1:36 1:1881 ... ...

! define a variable that is the average water temperature from zero to fifty meters
let Zave=water_temp[Z=0:50@ave]

! define a region of interest
set region /X=160W /Y=20N /T=1-OCT-2015:30-OCT-2015

! generate a small plot for showing below (use larger sizes for better quality)
set window /xpix=600 /ypix=450 1

! use the machine's Arial font for this small plot
set text /font=Arial

! plot the average
! this is when Ferret finally reads in only the water temperature data it needs from the remote site
plot /title="TEMP[ave over Z=0:50]" Zave

! as an afterthought, add the surface and 50m temperature plots to the original
! this data is still present in Ferret's memory
plot /over water_temp[Z=0]plot /over water_temp[Z=50]

! save the image as a PNG file
frame /file=HI160W20NTempAve.png

! clear the window for a new plot
set win /clear

! remove the region restriction
cancel region

! make a color 2D plot of temperature over the entire defined region
! more data needed, so Ferret goes back to the remote site to get the required temperature data
shade temp[Z=0,T=1-OCT-2015]

! save the image as another PNG file
frame /file=HITemps.png

! end of the script%
The plots produced from the above are shown here: