
How to use the Ferret polytube script
Below is an annotated version of the script polytube_demo.jnl
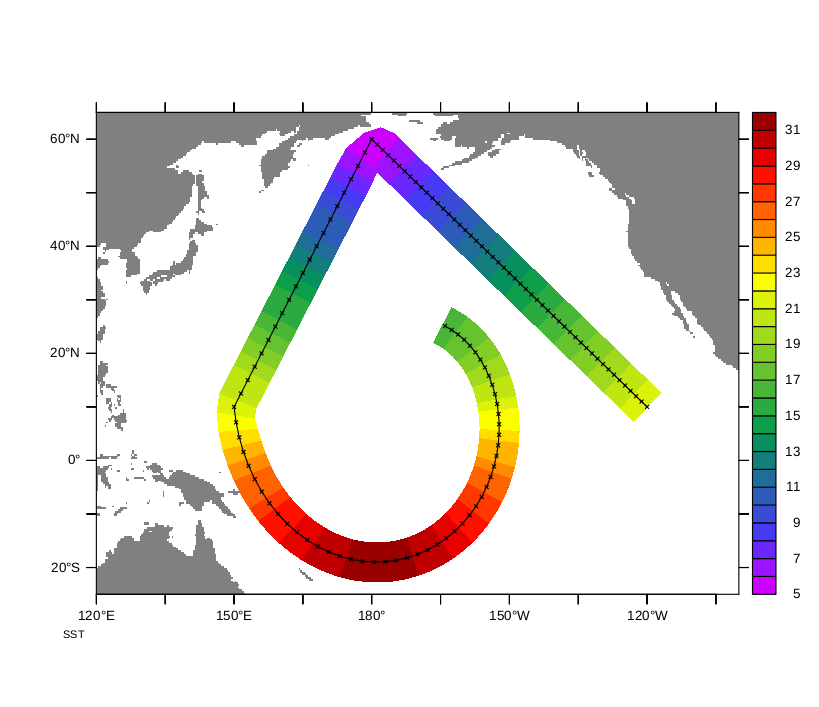
Description: demonstrate "Lagrangian" plots along a path using color fill
See also Ferret's RIBBON plot style.
yes? ! Define a 3-leg plot track with discontinuities
yes? LET/QUIET X0 = 240
yes? LET/QUIET Y0 = 10
yes? LET/QUIET X1 = 180
yes? LET/QUIET Y1 = 60
yes? LET/QUIET X2 = 150
yes? LET/QUIET Y2 = 10
yes? LET/QUIET XLEG1 = X0 + (L-1)*(X1-X0)/50
yes? LET/QUIET YLEG1 = Y0 + (L-1)*(Y1-Y0)/50
yes? LET/QUIET XLEG2 = X1 + (L-51)*(X2-X1)/20
yes? LET/QUIET YLEG2 = Y1 + (L-51)*(Y2-Y1)/20
yes? LET/QUIET LCURVE = L-71
yes? LET/QUIET R0 = 35
yes? LET/QUIET RADIUS = R0 - LCURVE/3
yes? LET/QUIET XLEG3 = X2+R0 - RADIUS * COS(LCURVE/12)
yes? LET/QUIET YLEG3 = Y2 - RADIUS * SIN(LCURVE/12)
yes? LET/QUIET XSTRAIGHT = IF L LE 50 THEN XLEG1 ELSE XLEG2
yes? LET/QUIET YSTRAIGHT = IF L LE 50 THEN YLEG1 ELSE YLEG2
yes? LET/QUIET XTRACK = IF L LE 70 THEN XSTRAIGHT ELSE XLEG3
yes? LET/QUIET YTRACK = IF L LE 70 THEN YSTRAIGHT ELSE YLEG3

yes? LET/QUIET SST = 25 - YTRACK/3
yes? LET/QUIET wind = ytrack/20 * RANDN(ytrack)
yes? SET REGION/L=1:120

yes? ! Plot SST and indicate the ship track
yes? go basemap x=120:260 Y=25s:65n 20
yes? go polytube polygon/over/key/title="SST" xtrack ytrack SST
yes? plot/vs/line/sym/over/nolab xtrack, ytrack
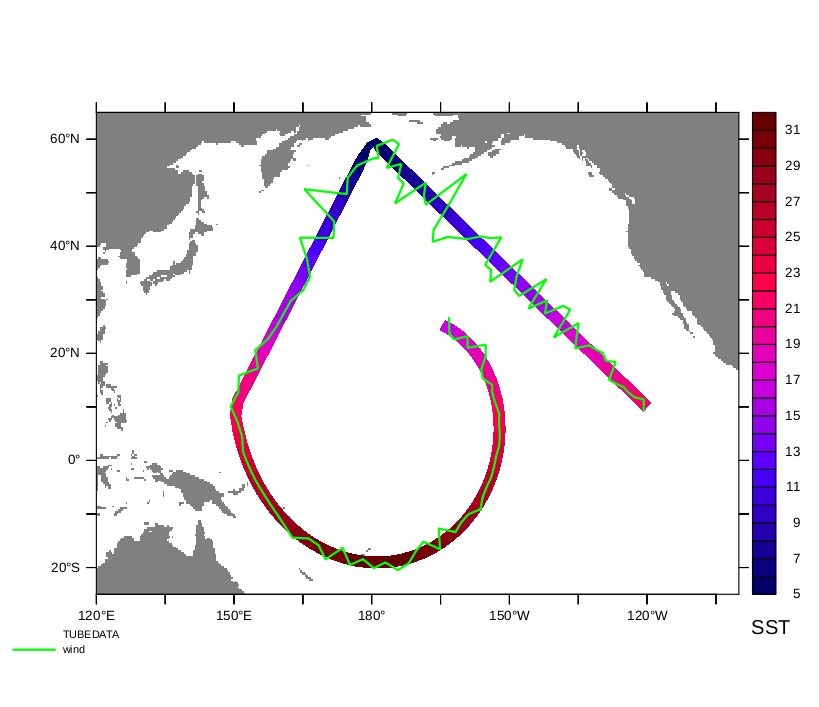
A similar plot, but a thinner "tube" with a different palette, and another variable drawn with it
yes? go basemap x=120:260 Y=25s:65n 20
yes? go polytube polygon/over/key/pal=no_green xtrack ytrack SST 0.3
yes? label/nouser `1.05*($ppl$xlen)`,-.5,0,0,.15 SST
yes? go trackplot plot/vs/line/over/color=green/thickness=2/title="wind" xtrack ytrack wind
exercise: compare this similar plot, but a thinner "tube" drawn with the PLOT/VS/RIBBON command.
yes? go basemap x=120:260 Y=25s:65n 20
yes? ribbon/vs/over/line/thick=3/key/title="SST" xtrack, ytrack, SST