FAQ
Locating Labels on a Time-Axis plot
Locating Labels on a Time-Axis plot
Question:
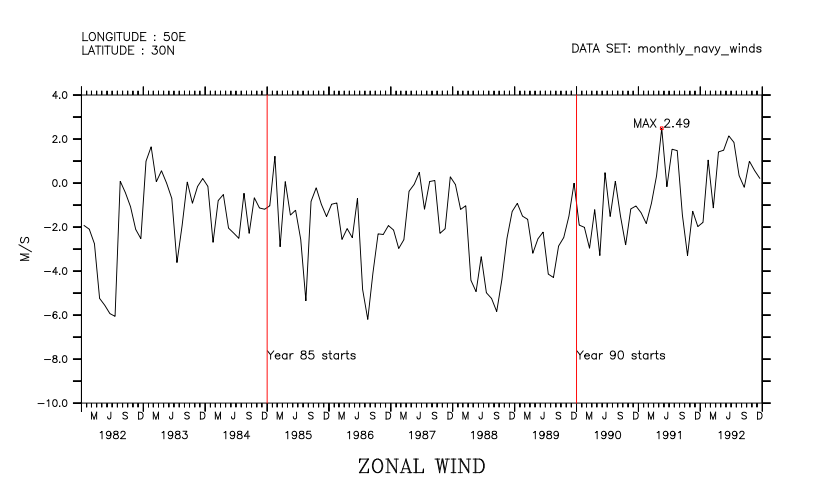
How can I position labels on a plot that has a time axis?
Example:

Solution:
Define a variable with the desired time axis, and then draw a 1-point plot line using this location. Now the PPLUS symbol PPL$XFIRST1 is defined, and this can be used in the LABEL command to position the label. Here is the script for the above plot:
! Open a dataset and define a time-series variable. Plot the time series.
!----------------------------------
USE monthly_navy_winds.cdf

LET/title="`uwnd,RETURN=title`"/units="`uwnd,RETURN=units`" var = UWND[X=50E,Y=30]

PLOT/VLIM=-10:4 var

!----------------------------------
! define a variable with the time coordinates
LET tt=T[GT=var]

!----------------------------------
! Locate label position on time variable axis: the coordinate at the start of 1985.
LET datelabelpos=TT[T="01-JAN-1985"@ITP]

! Do nothing but set $PPL$XFIRST1 symbol at the time axis plot units
PLOT/LINE/VS/OVER/NOLAB datelabelpos,-9

! Make the label; left-justified
! LABEL xpos, ypos, justify, rotate, height "text"
LABEL ($PPL$XFIRST1),-8,-1,0,0.12,Year 85 starts

! Draw a vertical red line at the year boundary
PLOT/VS/NOLAB/LINE/COLOR=RED/OVER {`datelabelpos`,`datelabelpos`},{-10,4}

! Do the same for the start of 1990

!----------------------------------
! Locate label position on time var axis
LET datelabelpos=TT[T="01-JAN-1990"@ITP]

! Do nothing but set $PPL$XFIRST1 symbol at the time axis plot units
plot/line/vs/over/nolab datelabelpos,-9
! LABEL xpos, ypos, justify, rotate, height "text"
LABEL ($PPL$XFIRST1),-8,-1,0,0.12,Year 90 starts

! Draw a vertical red line at the year boundary
PLOT/VS/NOLAB/LINE/COLOR=RED/OVER {`datelabelpos`,`datelabelpos`},{-10,4}

!----------------------------------
! Now lets locate and label the maximum of the variable

LET vmax = `var[T=@MAX]`
LET t_at_max = var[T=01-JAN-1985:01-JAN-1998@LOC:`vmax`]

! This will define $PPL$XFIRST1 and also make a mark at the maximum location
PLOT/VS/OVER/NOLAB/SYM=17/COLOR=red t_at_max, vmax

! Use a centered label this time
! 1.02*vmax moves the label up a bit.

! LABEL xpos, ypos, justify, rotate, height "text"
LABEL ($PPL$XFIRST1),`1.02*vmax`,0,0,0.12,MAX `vmax,prec=3`
For ideas about putting a date-string label on a plot, see the FAQ labeling-dates-along-a-trackline.
