FAQ
black and white graphics
black and white graphics
Question:
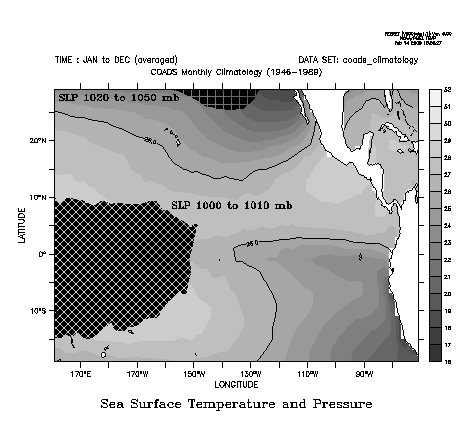
Got any good ideas for black & white graphics?
Example:

Solution:
To create nice looking black & white graphics you willprobably want to use some combination of
- grayscale palettes (black, white, gray, grayscale)
- contour lines
- patterns
The figure above was created with the following script:
! b_and_w.jnl
! Some ideas for nice black and white plots.

set win/size=.2

! Colors and patterns can be overlaid;

patterns are transparent

set data coads_climatology
set reg/l=1:12/y=20s:30n/x=160e:70
set mode cal months

! Use a grayscale palette.

fill/title="Sea Surface Temperature and Pressure"/pal=grayscale/lev=(16,32,1) sst[l=@ave]

! Tasteful use of contours to help

interpret the levels of gray.
contour/over/nolab/lev=(26) sst[l=@ave]

! Patterns can be used with any palette (black, white, gray) to overlay other data.

fill/over/nolab/lev=(1000,1010,10)/pal=black/pat=angled_grid slp[l=@ave,y=20s:20n]
label/user,202,8,-1,0,.15,@trSLP 1000 to 1010 mb

fill/over/nolab/lev=(1020,1050,30)/pal=black/pat=large_grid slp[l=@ave,y=20n:60n]
label/user,205,27,1,0,.15,@trSLP 1020 to 1050 mb
! Fill the land with white to have
nice looking continents.go fland 20 whitego land
